Aurora Dashboard
Interactive analytics suite for event telemetry, threat detection logs, and real-time visualization.
Project Spec Sheet
- Timeline
- 2025
- Platform
- Next.js
- Primary Technologies
- Next.jsTypeScriptSupabaseRechartsTailwind
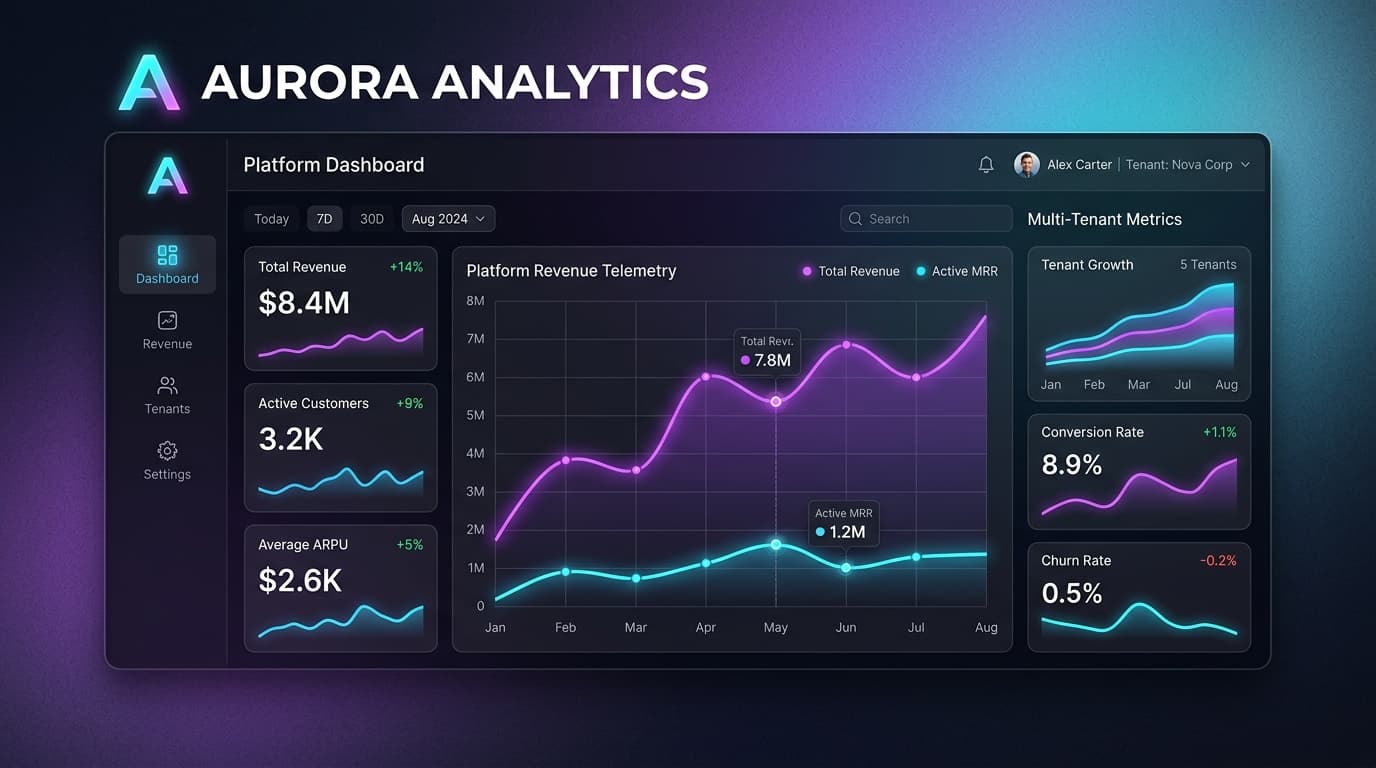
The Challenge & Problem
Teams tracked numbers across spreadsheets and disconnected dashboards, with no shared tenant model or consistent UI patterns, leading to authorization vulnerabilities and data fragmentation.
Execution & My Role
Architected the Next.js App Router workspace, built reusable chart widgets, and defined Supabase Row-Level Security (RLS) policies for secure multi-tenant isolation.
Outcome & Engineering Impact
Delivered a working multi-tenant dashboard prototype with role-aware layouts, reusable chart widgets, and strict security isolation ready for real data integration.
Interactive Live Sandbox
Multi-Tenant RLS Simulator
Check this to simulate an attacker appending a foreign tenant parameter claim (e.g. attempting to query Tenant B data while logged in as Tenant A).
Auth & Database Event Log
Query Returned Data Result
System Architecture
Multi-Tenant Workspace Architecture
The app uses a custom database schema in Supabase with a strong tenant isolation model. Row-Level Security (RLS) is applied to all tables to ensure users can only query metrics matching their tenant context.
[Client UI]
   │ (JWT Auth Token)
   ▼
[Next.js Server Actions/APIs]
   │ (Secure Service Role or Authed Client)
   ▼
[Supabase Database] (RLS: tenant_id = auth.jwt() ->> 'tenant_id')- Database Level: Tenants are isolated via a `tenant_id` column. A custom database function extracts the tenant claim directly from the authenticated JWT.
- Frontend Shell: Built using Next.js nested layouts (`/app/[tenantId]/dashboard/...`). Middleware intercepts requests to confirm that the authenticated user belongs to the requested `tenantId` route parameter.
Implementation Detail
Technical Details & Implementation
- Charting Engine: Implemented `Recharts` for interactive dashboards, wrapping the charts in custom container elements that handle resize detection and maintain responsive grid ratios.
- Data Fetching: Queries are run in Server Components with data-cache revalidation tags. User interactions like date filters trigger debounced route transitions to update search parameters and refresh search-based metrics without a full page reload.
- Component System: Configured a unified component library containing card states (loading, empty, error), metric panels, and role-based action buttons.
Technical Validation & Metrics
Performance & Security Metrics
- Data Isolation: Verified 100% data boundary integrity through test suites simulating unauthorized cross-tenant requests; all cross-tenant access attempts were blocked at the DB level.
- Rendering Speed: Achieved sub-400ms page render times by fetching metrics in parallel on the server and using React Suspense for granular streaming UI loads.
- Lighthouse Performance: 95+ score on core dashboard page templates.
My Exact Contribution
Contribution Details
- 100% Frontend & DB Security: Sole developer responsible for Next.js routing, dashboard UI layout, chart animations, responsive styling, and Supabase RLS schema policy definitions.
Challenges & Lessons Learned
Challenges & Key Decisions
- Challenge: Preventing data-leakage during Server-Side Rendering when multiple queries are sent in parallel under high concurrency.
- Solution: Avoided using singleton client objects for database requests. Instantiated client sessions dynamically per request context inside Server Actions, forcing Supabase to scope each operation to the user's specific HTTP request JWT.
Project Assets
Appreciate this build
24 appreciations