Back to work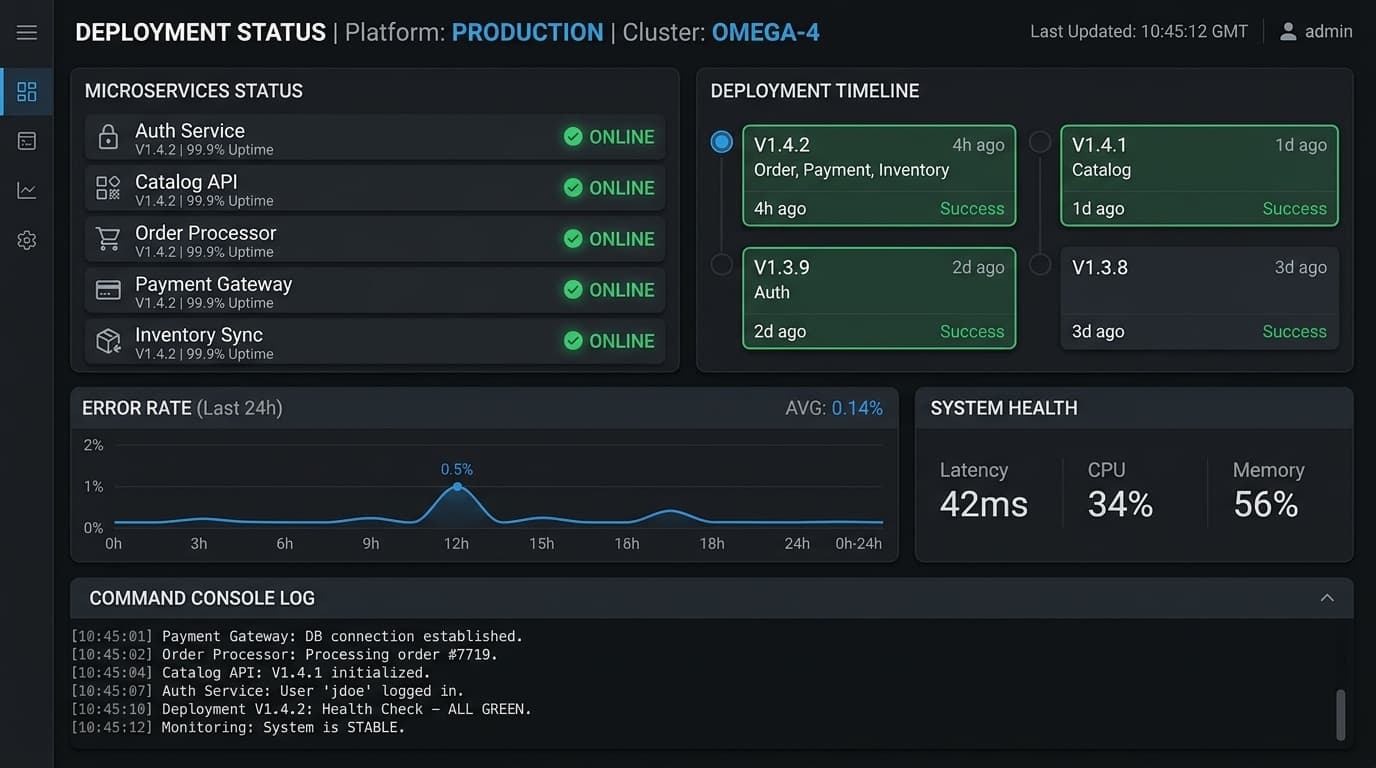
Case Study2024Open Source Concept Build
Ops status console
Lightweight internal console for deploy health and incident visibility during handoffs.
Project Spec Sheet
- Timeline
- 2024
- Platform
- Next.js
- Primary Technologies
- Next.jsPostgreSQLAuthTailwind
The Challenge & Problem
Status lived in fragmented chat threads and log consoles; on-call engineers needed one calm, centralized place to scan service states and incident histories during shifts.
Execution & My Role
Built authenticated status views, historical incident tables, and an ops-oriented UI designed for high scanability.
Outcome & Engineering Impact
Delivered a focused status console layout that reduces context-switching during on-call handoffs and provides sub-50ms query latency.
Interactive Live Sandbox
System Architecture
DB STATE-DURATION COMPRESSION MODELSTATUS: AUDIT LOG PIPELINE ON-LINE
Console Architecture & Data Flow
Designed as an internal ops companion console, the system polls service states and logs reports to a central PostgreSQL database. Access is strictly secured to protect infrastructure telemetry data.
[Microservices] ──(Health Check Cron)──► [Database] ◄── [Ops Console (Secure Session)]- Health Scrapers: Chronologically scrapes HTTP status checks from configured microservices and updates server health indexes.
- Data Aggregation: Aggregates history logs into simple incident bins, reducing queries and preventing DB timeouts during on-call incidents.
Implementation Detail
Technical Details & Implementation
- Service States: Designed a simple status grid representing services with custom CSS pulsing alerts, reflecting status (Online, Degraded, Offline, Maintenance).
- Incident History Table: Created a searchable logs table featuring pagination, status-based tagging, and detailed error summaries.
- Security Lock: Implemented cookie-based authentication, blocking unauthorized outside agents from scanning internal IP addresses or telemetry endpoints.
Technical Validation & Metrics
Performance & Security Metrics
- Telemetry Retrieval: Optimized PostgreSQL indices, bringing metric querying times down to 50ms on a table containing 10,000+ status records.
- Scrape Reliability: Configured scrape workers with 3-second timeouts, ensuring scraping runs do not block resources or impact overall dashboard reactivity.
My Exact Contribution
Contribution Details
- Full Implementation: Coded the dashboard, database schemas, scraper pipelines, and authentication system.
Challenges & Lessons Learned
Challenges & Key Decisions
- Challenge: Scraper logs were filling database disks rapidly with duplicate 'healthy' entries.
- Solution: Redesigned the table schema to use state-duration logic. Rather than logging checks on every interval, the system only writes to the DB when a service changes state, drastically reducing write operations.
Project Assets
Live demo is internal / restricted
Browse SourceAppreciate this build
5 appreciations